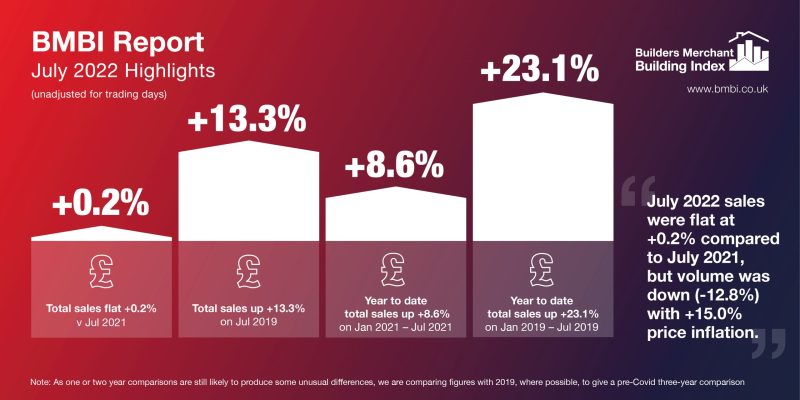
July’s value sales were flat +0.2% compared with July 2021 – compared with pre-Covid July 2019, sales were +13.3% higher
Total Builders Merchants value sales were flat (+0.2%) in July 2022 compared July last year. Volume sales were -12.8% lower with price up +15.0%. There was no difference in trading days. Ten of the twelve categories sold more. Nine categories performed better than Merchants overall, including Renewables & Water Saving (+25.5%) Workwear & Safetywear (+20.2%), Kitchens & Bathrooms (+13.1%) and Plumbing, Heating & Electrical (+10.7%). Landscaping (-4.6%) and Timber & Joinery Products (-14.4%) sold less.
Total value sales in July 2022 were +13.3% up on the same month three years ago (a more normal year pre Covid). Volume sales fell -13.9% – prices rose +31.6%. With two less trading days this year, like-for-like sales (which take trading day differences into account) were up +24.1%. Three of the twelve categories sold more than merchants overall. Timber & Joinery Products (+23.8%), Renewables & Water Saving (+18.6%) and Landscaping (+17.7%) did best. Other categories grew more slowly, including Heavy Building Materials (+12.3%), Kitchens & Bathrooms (+11.3%) and Plumbing, Heating & Electrical (+2.9%). Miscellaneous (-4.5%) was weakest.
Total Merchants sales were -2.6% lower in July 2022 than in June 2022. Volume sales were -5.2% down with price up +2.7%. With one more trading day like-for-like sales were -7.3% down this month. Renewables & Water Saving (+4.8%) grew most. Landscaping (-9.1%) was weakest.
July’s overall BMBI index was 151.5, particularly helped by Landscaping (195.5) and Timber & Joinery Products (171.0), with no difference in trading days. Almost all categories recorded indices exceeding 100, including Heavy Building Materials (147.0), Kitchens & Bathrooms (143.1) and Ironmongery (135.3). Only Renewables & Water Saving (90.4) fell below 100.
Total sales in May to July 2022 were +4.4% higher than in May to July 2021, with price inflation of +16.5%, volume down -10.4%, and no difference in trading days. Ten of the twelve categories sold more than merchants overall. Renewables & Water Saving (+20.0%), Kitchens & Bathrooms (+17.4%) and Workwear & Safetywear (+14.4%) did best. Timber & Joinery Products (-7.2%) was weakest.
Compared with the same months three years ago (May to July 2019), May to July 2022 sales were ahead +22.4%, driven by price (+30.0%) not volume (-5.8%). With two less trading days this period like-for-like sales were +26.4% ahead. All categories sold more. Two categories stood out: Timber & Joinery Products (+33.4%) and Landscaping (+31.3%). Heavy Building Materials (+20.5%), Kitchens & Bathrooms (+19.0%), and Plumbing, Heating & Electrical (+10.7%) grew less. Tools (+3.6%) was weakest.
Total sales in May to July 2022 were +4.2% up on the previous three months, February to April 2022, driven more by price inflation (+2.5%) than volume (+1.6%), with no difference in trading days. Ten of the twelve categories sold more. Landscaping (+8.8%) and Heavy Building Materials (+7.3%) did better than merchants overall. Decorating (+3.9%), Kitchens & Bathrooms (+2.2%) and Ironmongery (+1.2%) grew less. Plumbing, Heating & Electrical (-8.6%) was weakest.
The current year to date, January to July 2022, was +8.6% higher than January to July 2021. Volume sales were -6.7% lower with price up +16.3%. With one less trading day this year like-for-like sales were +9.3% higher. All categories sold more. Kitchens & Bathrooms (+20.8%) was strongest followed by Renewables & Water Saving (+20.7%). Plumbing, Heating & Electrical (+12.7%) Heavy Building Materials (+12.0%) and Decorating (+9.3%) grew more than merchants overall. Landscaping (+0.5%) was weakest.
Sales in the current year to date, January to July 2022 were +23.1% ahead of three years ago – January to July 2019. Price inflation was +26.7%, and volume was down -2.8%. With three less trading days in the most recent period like-for-like sales were +25.7% higher. All categories sold more. Landscaping (+39.4%), Timber & Joinery Products (+36.4%) and Renewables & Water Saving (+28.4%) performed better than Merchants overall. Tools (+4.9%) was weakest.
Total Merchants sales in August 2021 to July 2022 were +11.5% higher than in August 2020 to July 2021, with price inflation of (+16.5%), and volume (-4.2%). No difference in trading days. All categories sold more. Renewables & Water Saving (+17.2%) grew most. Kitchens & Bathrooms (+16.6%), Timber & Joinery Products (+14.8%), Heavy Building Materials and Plumbing, Heating & Electrical (both +11.9%) also did well. Workwear & Safetywear (+2.8%) was weakest.
Total Merchants sales in August 2021 to July 2022 were +20.4% higher than in the 12 months August 2018 to July 2019. With two less trading days in the most recent period like-for-like sales were +21.3% higher. Eleven of the twelve categories sold more with Timber & Joinery Products (+39.1%) and Landscaping (+36.1%) well out in front. Other categories saw lower growth including Heavy Building Materials (+14.7%), Kitchens & Bathrooms (+13.9%) and Plumbing, Heating & Electrical (+6.0%). Tools (-1.5%) was weakest.
The July 2022 BMBI report is available to download here.